
Las Vegas Home Prices Up 2% - Largest Monthly Increase Since May 2006
The Case Shiller index of 20 cities showed a 9.3% increase in home prices since February 2012. The price gains should cause more and more homeowners to put their homes on the market, which would alleviate our low inventory.
There were only 1.93 million homes on the market in March, which was the fewest number since March 2000.
With mortgage rates at an all-time low, an improving labor market, and more inventory, the real estate market could be the source for a better economy.
The 20 cities show a year-over-year increase. Las Vegas home prices jumped 17.6% since last year. Phoenix led the yearly increase with a 23% jump.
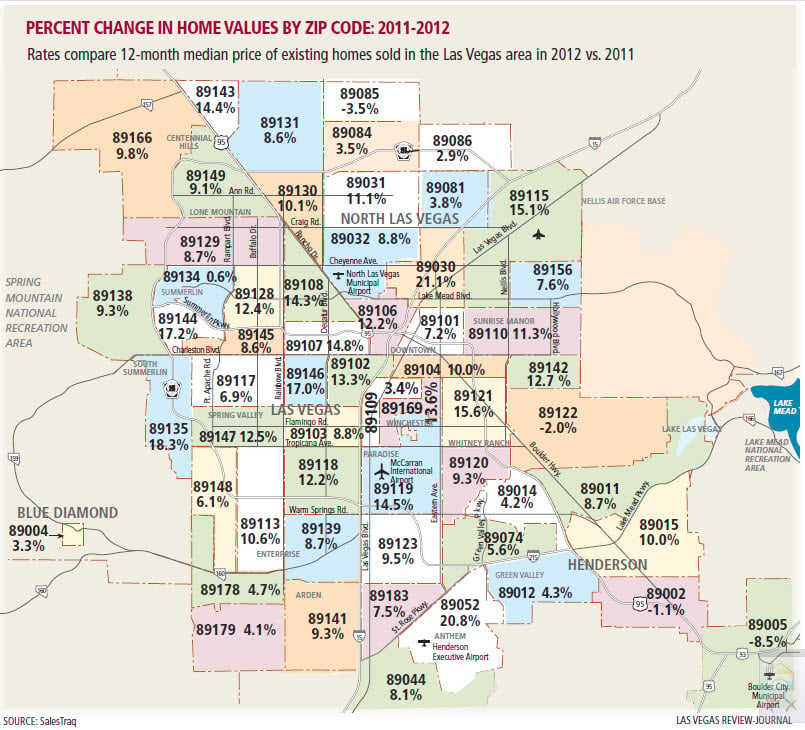
Check the map below for a breakdown by zip code appreciation.